Sections, rows, and columns
PERMISSIONS Users with security levels that allow the creation of LiveReports. Any security level in Autotask can be configured with this permission. Refer to Configure access to LiveReports Designer.
NAVIGATION Left Navigation Menu > Admin > Admin Categories > Features & Settings > LiveReports > LiveReports Designer
If you're familiar with Microsoft Excel, you will notice many similarities when editing LiveReports, especially when it comes to formatting and navigating within the cells.
- Use the cursor keys and/or mouse clicks to navigate between cells.
- For multi-cell select, left-click the beginning cell, hold the Shift key, and left-click an ending cell.
- For non-sequential select, left-click the desired cell, hold down the control key (CTRL) and click other cells to add to the selected ones.
- To add multiple columns and rows at one time, either Shift-click or CTRL-click the column and row coordinate headers then select Insert Columns/Rows Before/After from the pop-up menu.
You use Section options to add, remove, and delete page layout elements like a name, headers or footers, or group headings in your report output.
The type of section you select dictates how LiveReports will treat the data in the rows in that section and where it will appear on the generated report.
IMPORTANT The total height of all the rows in the Page Header section cannot exceed the length of one page in PDF format. This size is set in the Options page of LiveReports Designer. If you feel your report approaches this limit, run the report as HTML first to see if the headers will be displayed on more than one page.
To add a section:
- To open the page, use the path(s) in the Sections, rows, and columns section above.
- Open the report in Edit mode.
- Click in the Section column for the row you wish to add.
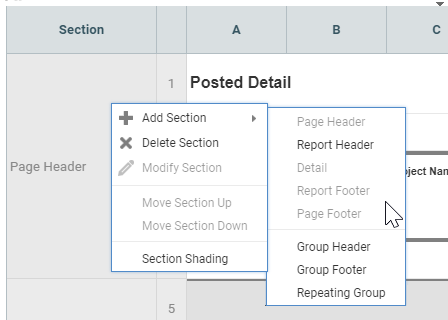
- Mouse over Add Section for the sub-menu to appear.
- Choose the Section type or other Section option.
| Field | Sub Field | Description |
|---|---|---|
| Add Section | Adds a new section to the report via a sub-menu. | |
| Page Header | Adds a new page header section for the report for every page. Page Headers display at the top of the first page of Excel and HTML exports, and on every page of PDF and RTF exports. They display above Report Headers and are the default first line of the table. Column headers are typically placed in this section, as well as the name of the report. For more information on adding a name, refer to Adding a name or Working with columns below. IMPORTANT This type of section is not intended to display data fields or perform calculations. Group Headers, Group Footers and Repeating Groups should be used to display data fields. Those sections plus Report Footers can be used for aggregating columns. |
|
| Report Header | Adds a new report header section for the report at the top of the first page of reports. TIP Report Headers display below Page Headers. For this reason, we recommend only using Report Headers for your name if you do not use any Page Headers. |
|
| Detail | Rows that will return information. Your data fields will be placed here. By default, the Detail Section is placed below the Page Header. | |
| Report Footer | Adds a new report footer section at the end of the report. Report Footers display at the bottom of the first page of reports exported to Excel and HTML, and the last page of those exported to PDF and RTF. They display before Page Footers and can be used for summing columns. Refer to Summing columns for more information. | |
| Page Footer | Adds a new page footer section for each page. Page Footers display at the bottom of the first page of reports exported to Excel and HTML, and on every page for those exported to PDF and RTF. They display below Report Footers. Refer to Summing columns for more information. IMPORTANT This type of section is not intended to display data fields or perform calculations. Group Headers, Group Footers and Repeating Groups should be used to display data fields. Those sections plus Report Footers can be used for aggregating columns. |
|
| Group Header |
Separates groups of information on your report. Choose any Data Category or Sort Field as a Group Header. EXAMPLE You are interested in viewing the items approved and posted during the month of January for all your customers. There are likely multiple billing items for each customer so you really only want to see that customer name once. In this case, you would create a Group Header for the Customer data, then a detail area below for the billing data. Also refer to Difference between grouping on data categories and grouping on sort fields. |
|
| Group Footer |
Separates groups of information on your report. Choose any Data Category or Sort Field. Group Footers are used to aggregate data, such as sums and averages. EXAMPLE You want to know the total billed amount for each customer for the month of January. To accomplish this, you would create a Group Footer on Customer, and add the Billed Amount field from the Posted Billing Item category and click the Autosum (∑) button. Also refer to Difference between grouping on data categories and grouping on sort fields. |
|
| Repeating Group | Refer to Repeating groups. | |
| Delete Section | Deletes the entire section, including subsequent rows in that section. | |
| Modify Section |
Allows for modification of a Repeating Group. EXAMPLE Use this for changing the sort criteria that the Repeating Group repeats on. |
|
| Move Section Up | Moves the highlighted section up one section level. | |
| Move Section Down | Moves the highlighted section down one section level. | |
| Section Shading | Adds selected color to the section. When shading is applied to any section, a small square, in the shading color, appears in the upper right corner of the header of the far right column.  |
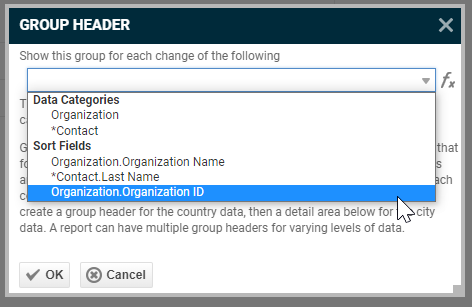
When you add a group header or group footer section to a report, you must select what you will be grouping on. You always get a list of data categories (more accurately, sub-categories) and a list of sort fields. What is the difference?
When you select a data category to group on, you will always be grouping on a unique ID (the "primary key" of the selected item). In the screen shot above, selecting the "Organization" data category will group the items by the unique organization ID. If you had three organizations in your Autotask instance named "ACME Corporation", each would have a different ID, and the items would be grouped separately for each instance of "ACME Corporation".
If you grouped on the Sort Field "Organization.Organization Name", all items for organizations with the same name would be grouped together. In our example, all billing items for all instances for "ACME Corporation" would be grouped under a single group header or footer.
NOTE It is possible that the primary key field associated with the sub-category is not exposed. In cases where we do expose the primary key (for example the Organization ID in the screen shot above), then selecting the Organization sub-category would be the same as selecting the sort field Contract ID.
Also, you could add multiple sort fields for any data category, so grouping on sort fields allows you to group records by something other than the data category's primary key.
Reports often have names that display above the information in the report. In LiveReports you can add a name that displays on every page of the report, or one that displays only on the first page of the report. This is controlled by the type of Section you place the report name into.
- To display the report name only at the top of the first page of your report, place the report name into the Report Header section.
- To place a name at the top of every page of the report, place the report name into the Page Header section.
TIP Column headers are placed into the Page Header section. If you use column headers for your report, we recommend that you put your name into the Page Header section, because the Report Header section appears below the Page Header section. Displaying the report name below the column headers would look strange.
For more information, refer to Adding column headers below.
NOTE Excel reports do not have pages in the general sense; rather they are one long page. Printing a report might yield more than one page, but the Page Header section will only print on the first page as Excel will treat this as one extended page.
HTML report output is paginated, with the Page Header displayed at the beginning of each "page".
To add a name:
- Navigate to LiveReports Designer.
- Decide if you are using Report Headers, Page Headers, or both.
- Note the first column on the design table called Section.
If you are using a Report Header:- Click any cell in the Section column. A menu opens.
- Mouse over Add Section. A sub-menu opens.
- Select Report Header from the menu. The Report Header Section is added.
- Select a cell in this new section and type your report name into the cell.
or
If you are using a Page Header and you did not use a Report Header:- Select a cell in the Page Header section and type your report name into the cell.
- Click Save to save the report.
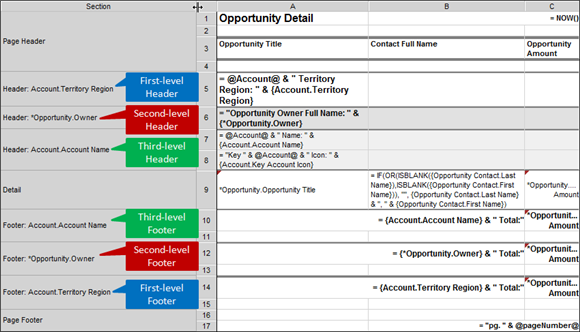
EXAMPLE Business Case: You are in charge of sales at your company. You have just finished a quarter and need to generate a report for your CEO that shows sales results ("Closed Opportunities") by sales territory, account manager and customer. You would like to display subtotals for all three metrics on your report, in addition to the overall totals.
If you want to group and subtotal report data by more than one field, you must get the data hierarchy right. If there are multiple sales people per territory, the group header for territory must be above the group header for account manager, and the group footer for territory must be below the group footer for account manager as illustrated in the screen shot below.
NOTE For summing and aggregating columns, group headers are optional, but they make a report easier to read.
For information on totaling and subtotaling columns using group, page and report footers, refer to Summing columns.
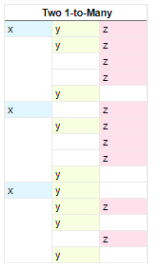
Repeating groups are a way to organize and display data which contains multiple one-to-many relationships. Each repeating group has data from a "many" category, grouped by the "one" category. The following diagrams demonstrate how this works.
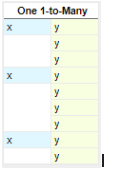
Two categories, X and Y, with a one-to-many relationship from X to Y, will display like this in a Detail section. Each X has one or more Y.
If there is a third category, Z, with a one-to-many relationship from X to Z, there is not necessarily a relationship between Y and Z.
You use repeating groups when you want to ignore the relationship between Y and Z, and simply organize the data by X. To do so, create two repeating groups for X, and put Y in the first, and Z in the second:
Each repeating group section has its own group header, detail, and group footer. These follow the same principles as their general purpose equivalents, but within the repeating groups. For example, to calculate aggregate data for Y for each X, use an aggregate formula in the footer for the repeating group with the Y data.
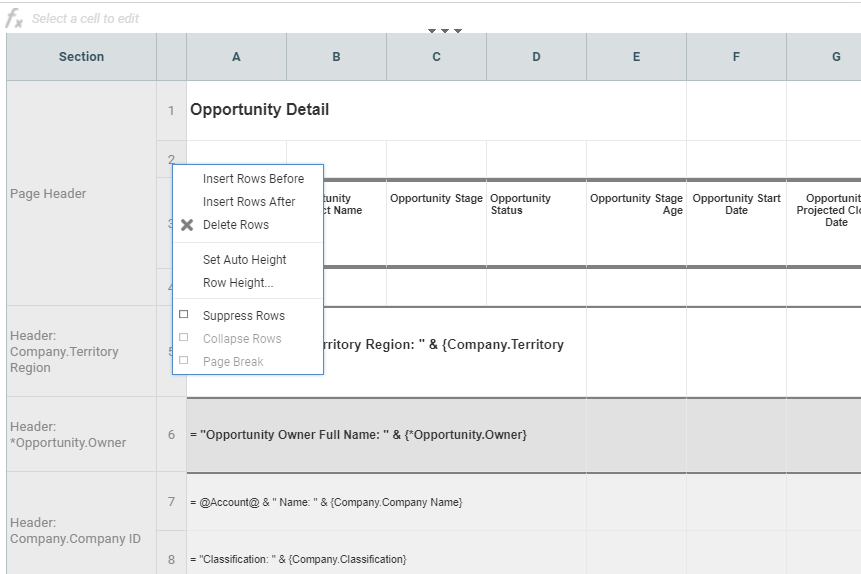
Use the row settings to modify individual rows. You can insert or delete rows, suppress rows so they do not display, create page breaks, and set row height automatically.
To change a row:
- Navigate to LiveReports Designer.
- Click in the row number column for the rows you wish to change.
- Choose the new row option from the menu.
TIP Cell references auto-update when you insert columns or rows.
| Name | Description |
|---|---|
| Insert Rows Before | Adds a new row before the currently highlighted row. |
| Insert Rows After | Adds a new row after the currently highlighted row. |
| Delete Rows | Deletes highlighted rows. |
| Set Auto Height | Sets the row height to the minimum height required to the display the data in the row. Click OK. |
| Row Height | By default, rows are set to Auto Height. To set a specific row height in pixels, clear Auto Height and enter the height in pixels |
| Suppress Rows | Suppresses the row from being displayed. When this option is selected, the rows will appear with a dotted background in the designer. |
| Collapse Rows | A Group Section can be set to display as collapsed by default on HTML export. This causes the contents of the section to be suppressed and individually expandable for each change in Header. Collapsible rows are supported in the standard or Interactive HTML viewer. Non-HTML export formats will ignore Collapsible Rows. |
| Page Break | Creates a break in the page. When this is selected, a dashed line will be displayed for the selected row. For a Page Break to occur with each change in the value of a Data Field, place a page break on the top row of the Group Header Section for that Data Field. |
Columns are used to display specific data fields on your report.
As you are designing a report, you may decide that a column would look better in another place, or you may realize that you forgot to add a column, or you added one that you no longer need. With LiveReports Designer, it's easy to insert, delete, and reposition columns.
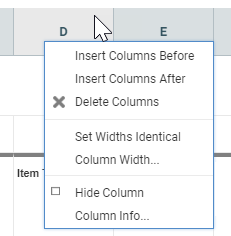
- To insert or delete columns, click the column header (A, for example). A menu opens containing the options you see below. You can also multi-select columns to insert or delete.
- To resize columns, select their table lines and move them to the right or left. You can also set an absolute column width in pixels.
- Check Hide Column to hide the column in the output
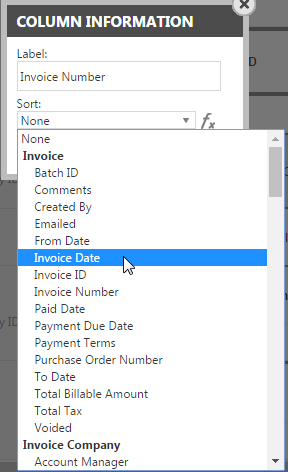
- Click Column Info. to create a label for the column and make it sortable in the Report Viewer.
Column headers display at the top of each column of a report. They tell you what the column of data represents. Sections tell LiveReports how to treat the data in rows. Use the section called Page Headers to designate the column headers for your report. For more information on report sections, refer to Working with Sections.
NOTE If you used the Layout Tab in the report wizard, it will create the column headers and the page header section for you using the sub-categories as the column headers.
To add column headers:
- Navigate to LiveReports Designer.
- Add the names of your column headers to the report.
- Click any cell in the Page Header row to select it (ex: Row 1, Column A). The cell becomes highlighted.
- Type the column header name into the cell.
- Continue adding column headers to the report as necessary using the next column in the same row.
- Click Save.
Reports often have totals that sum the data from the column above it. These totals display at the bottom of the report as report footers, or, if you're sub-totaling on a footer section, in a group footer or in a repeating group footer section. Totals can be derived in one of two ways:
- Use the AutoSum (∑) icon in the cell that will contain the total
- Use a formula to calculate the data. For more information on using formulas, refer to LiveReports formulas.
To sum columns:
- Navigate to LiveReports Designer
- Locate the column that you want to total. Add a new footer section below the last field in this column.
- In the Section column, click in the cell below your field. A drop-down menu displays.
- Select a Report Footer or Group Footer row type.
NOTE Page Footer row types do not support the use of formulas and calculations, including summing columns.
- Locate the column you want to total. Add the data field to the cell below the column in the Footer Section.
- Click the AutoSum (∑) icon to place the autosum formula into the cell.
- Click Save to save the report.
