Making changes to HTML report output
PERMISSIONS All users who can run a report
If you generate reports in HTML format (by clicking Run Report rather than exporting the report to Excel, RTF, CSV or PDF), they can be further modified once they are displayed in the report viewer.
Some interactive features are available in all HTML reports, including Express reports. Others must be enabled for each report in LiveReport Designer.
The HTML report output can be exported to the export formats allowed on the Report Options > General tab. Any changes made to the HTML report output are retained in the export, and can be saved as a new report.
In the top row that contains the letter reference for the columns, hover over the line between two columns. Click and hold to "grab" the line. Drag the line to the left or right to re-size the column. Text in the column will re-adjust.
Click in the column header above the report to sort by that column. Click again to reverse the sort order.
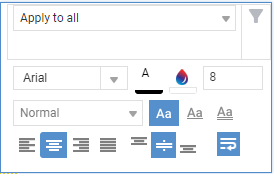
Right-click in a cell to open the mini-toolbar. This toolbar includes many of the styling options available in the LiveReports Designer edit page.
Select a formatting option.
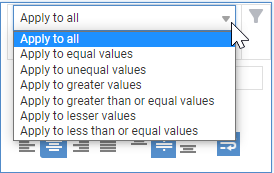
To apply formatting to other cells with content that meet a specified condition when compared to the currently selected cell, select a condition from the menu above the formatting tools.
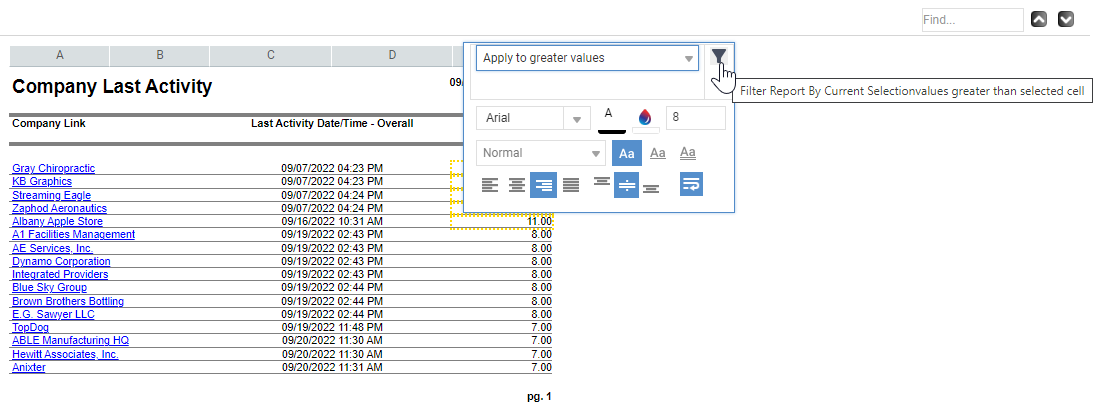
For example, if you are reporting on revenue, you can visually highlight revenue at the high end of the range.
- Select a cell that displays an amount that you want to use as your low value.
- Change the text or background color for that cell.
- From the menu, select Apply to greater than or equal values.
The new color will be applied to all cells in the column with a value greater than or equal to the selected cell.
Once you have applied conditional formatting, a filter icon will appear on the mini-toolbar, giving you the option to filter the report by the current selection.
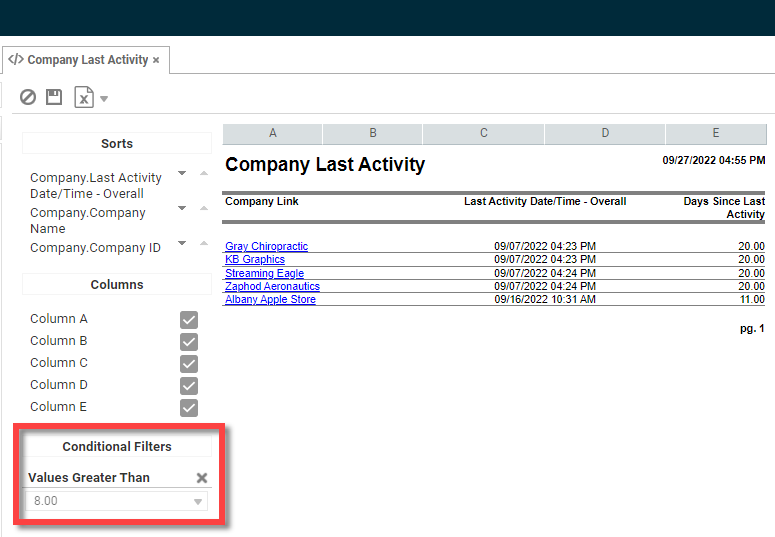
If you click the filter icon, the report is refreshed, and only records that meet the condition are displayed. The conditional filter is now displayed on the interactive panel dock of the report viewer.
Click the  Clear options icon and select Clear All, Clear Styling Changes, or Clear Column Changes to remove the selected changes from the HTML output.
Click the ![]() Save changes icon and select Save changes as new report. You will be prompted to enter a name for the new report. Enter a new name and select the folder to save it in.
Save changes icon and select Save changes as new report. You will be prompted to enter a name for the new report. Enter a new name and select the folder to save it in.
NOTE When you run the new report in HTML, all of the interactive changes (except for conditional filters) are automatically applied, but the full set of data that was in the original report is still available and can be accessed by deleting the filters. The same is true of any hidden columns.
Click the Download Report icon and select the desired output type. All changes supported by the selected format will be included in the new export format.
Interactive HTML options that are only available when they have been enabled for the report are located in the dock on the left side of the report output window. To show or hide the dock, click the three small triangles to the left of the report data.
You enable these options in the Edit Report view of the LiveReport Designer. Refer to Setting report output options.
NOTE Each set of interactive features is enabled separately. The features available in the HTML output can vary between reports, depending on which options are enabled for the report.
When this feature is enabled, you can hide individual columns, and display them again as needed.
NOTE You cannot hide the first column in a report.
- Locate the list of columns in the HTML dock and clear a column's check box to hide the column, or select the check box to display the column.
- To return a hidden column, you can also right-click in an alphabetic column header above the report. Select Un-hide Column to left/right.
For information on how to enable this feature, refer to Allow Hide/Show Columns in Report Viewer.
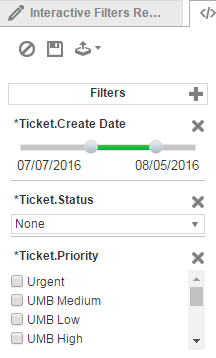
Reports can be configured so that users who run the report are able to apply filters to the HTML report output after the report is generated. These filters are available in the HTML dock.
These filters are configured on the Filters tab of the Report Viewer Options window. A check box determines if a filter is initially hidden or displayed. For information on how to configure this setting, refer to Initially Display Filter on Panel.
EXAMPLE You run a quarterly report called Invoice Totals by Organization. The report creator added an Invoice Date filter that allows you to change the date range for the report and limit it to the previous month.
To display filters that were initially hidden, click the ![]() Add Filter icon in the Filters header.
Add Filter icon in the Filters header.
To remove a filter, click the ![]() Remove Filter icon.
Remove Filter icon.
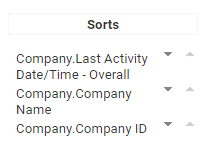
In the HTML dock on the left, under Sorts, locate the column for which you want to change the direction of the sort. The darker colored arrow indicates the current column sort direction. A down facing arrow indicates an ascending sort.
Click the lighter colored arrow to change the sort.
For information on how to enable this feature, refer to Sorts tab.
